
在线免费制作数据统计视频
用视频来展示数据会更加直观有效。试试用FlexClip做个视频,向别人展示你的统计成果吧!这里有数百万视频和图片素材供你使用。强大的编辑工具让你能轻松做出满意的效果,即使是新手也能快速掌握。快来试试吧!
免费制作视频 简单的视频编辑器
 种类繁多的模板
 海量媒体库资源
 动态文本
动态文本
- Trusted by:


专业的数据统计视频模板
 预览编辑
预览编辑现代公司报告样本
 预览编辑
预览编辑业务报告
 预览编辑
预览编辑研究报告介绍
 预览编辑
预览编辑专业年度公司报告业务视频
 预览编辑
预览编辑一季报
 预览编辑
预览编辑业务简单项目报告
 预览编辑
预览编辑公司 公司 业务年度报告
 预览编辑
预览编辑技术风格大数据影响清单
 预览编辑
预览编辑蓝橙 3d 业务报告
 预览编辑
预览编辑业务季度报告演示
 预览编辑
预览编辑销售报告
 预览编辑
预览编辑业务年中回顾报告视频
免费编辑、下载数据统计视频


为什么要做数据统计视频模板

促进销售
一个引人注目的视频能更大程度地影响购买行为、促进销售。

增加流量
在推动网站流量方面,没有什么能与视频内容相比。

鼓励社交分享
社交媒体平台上的视频获得的赞和分享比图片和文字加起来还要多。
数据统计视频制作三步曲
- 1
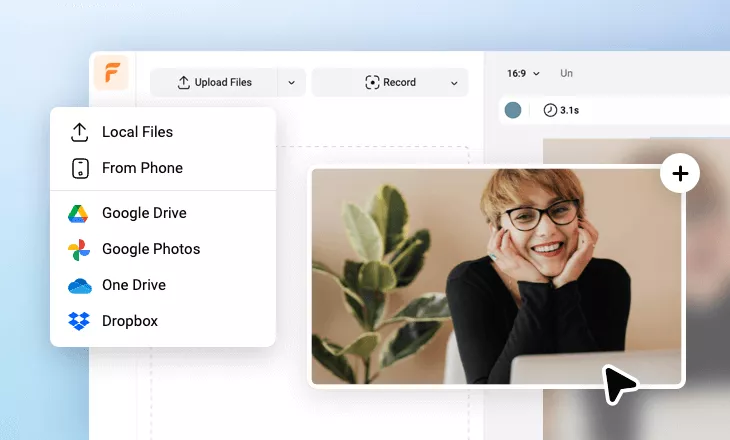
添加媒体文件
从电脑中上传视频、图片,或者从资源库中添加素材到故事版。
- 2
编辑
添加文本、音乐、画外音等来编辑你的数据统计视频。
- 3
输出
选择合适的比例和清晰度下载数据统计视频,然后分享给其他人。

轻松在线制作数据统计视频
免费制作视频